Intelligence · Operational
See how your hospital
is operating — in real time.
Bring capacity, patient flow, department performance, turnaround times and operational activity into one connected view.
- OPD footfall1,28412.4%
- Admissions1466.1%
- Discharges1320.8%
- Bed occupancy82.4%2.2%
- Average waiting time24min4%
- Discharge TAT3.2hrs18%
- OT utilisation76%0.4%
- Lab TAT58min11%
Patient flow · today
- 1,284OPD
- 146Admission
- 412IPD
- 638Diagnostics
- 132Discharge
Operational signal
Discharge TAT is 18% higher than the configured benchmark. 3 departments affected.
ExploreEvery figure on this page is an illustrative demo value, not a claim about any hospital's performance. Connected to a hospital's own systems, the interface uses that hospital's configured definitions, reporting periods, permissions and source data.
Capacity & utilisation
Know how much capacity is being used.
Hospitals constantly balance available capacity against demand. Understand where capacity is being used, where it is available, and where demand is creating pressure.
- General ward86%248 of 288 beds
- Private rooms78%78 of 100 rooms
- ICU91%58 of 64 beds · above the configured threshold
- Day care64%31 of 48 bays
- Total
- 500
- Occupied
- 412
- Available
- 88
- OT 1 · General82%14 of 17 sessions used
- OT 2 · Orthopaedics79%11 of 14 sessions used
- OT 3 · Cardiac71%5 of 7 sessions used
- Day-care theatre68%4 of 6 sessions used
- Theatres
- 8
- Sessions
- 34
- Cases
- 42
- Laboratory72%638 tests processed today
- Radiology68%284 studies today
- Imaging · CT and MRI61%96 scans today
- Pathology70%204 samples today
- Cases
- 638
- Pending
- 42
- Machines
- 11
Flow & throughput
See how patients move through the hospital.
How much is coming in, how much is being processed, and where the flow changes. This is operational volume, not the individual patient's relationship with the hospital.
- 1,284OPD visits
- 146Admissions
- 412IPD occupied
- 638Diagnostic cases
- 132Discharges
OPD throughput increased 12% against the previous period while average waiting time stayed within the configured threshold.
Turnaround time
Find where time is being lost.
See which operational processes are taking longer than expected — and where teams need attention.
An arrow is a direction, not a verdict. Waiting time is up 4% and still inside its target; discharge TAT is up 18% and outside it. Both point the same way, and only one needs somebody today.
Departments
See how each department is performing.
Where the operational volume is, and how each department is handling it — in one comparison, not five pages.
- Consultations
- 1,284
- Average waiting
- 24 min
- Capacity utilisation
- 84%
- Open at close
- 18
- Tests processed
- 638
- Lab TAT
- 58 min
- Capacity utilisation
- 72%
- Pending
- 42
- Occupied beds
- 412
- Discharge TAT
- 3.2 hrs
- Bed occupancy
- 82.4%
- ALOS
- 4.8 days
- Studies
- 284
- Radiology TAT
- 1.4 hrs
- Capacity utilisation
- 68%
- Reports pending
- 26
- Cases
- 42
- Case TAT
- 2.8 hrs
- OT utilisation
- 76%
- Cancellations
- 3
| Department | Volume | TAT | Utilisation |
|---|---|---|---|
| OPD | 1,284 | 24 min | 84% |
| Laboratory | 638 | 58 min | 72% |
| IPD | 412 | 3.2 hrs | 82% |
| Radiology | 284 | 1.4 hrs | 68% |
| OT | 42 | 2.8 hrs | 76% |
Workforce
Understand workload across teams.
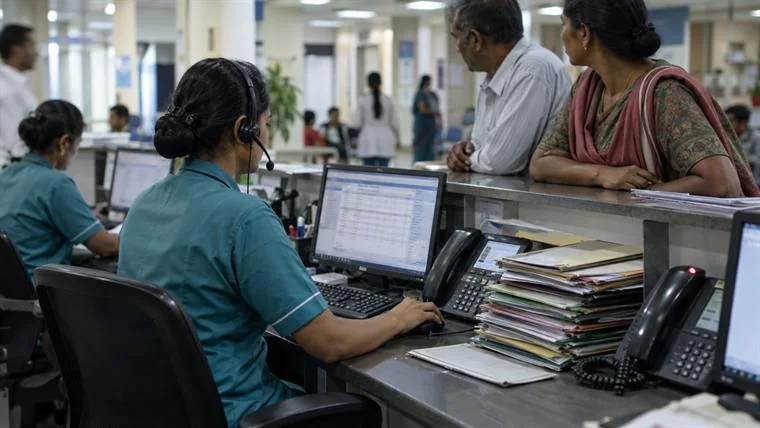
Operational performance depends on how work is distributed. This is workload visibility for planning — which desks are at their limit and which have room — not a scoreboard for individuals.
Team workload · share of configured capacity
- Billing96%At the configured limit
- Reception92%Peak between 10:00 and 13:00
- Laboratory84%
- Front desk73%
- Radiology58%Capacity available
Doctor productivity · today
- Dr Sharma42consultations
- Dr Rao38consultations
- Dr Mehta31consultations
Understand workload, productivity and operational pressure across teams.
Inpatient operations
Understand what is happening inside inpatient operations.
Bed availability, length of stay, and the operational time between one patient and the next.
- Bed occupancy rate82.4%2.2%
- ALOS4.8days0.1
- LOS · median3.9days0.3
- Bed turnover rate5.20.4
Bed occupancy · last 4 weeks
79.1% → 80.6% → 81.5% → 82.4% across weeks one to four.
Bed turnaround · discharge to next admission
Event
Discharge
Step
Cleaning · 18 min
Step
Inspection · 8 min
Step
Preparation · 16 min
Ready
Next admission
42 min total- Cleaning18 min
- Inspection8 min
- Preparation16 min
Patient Intelligence tells you what is happening with patients.
Operational Intelligence tells you what is happening across the hospital. Same data, different question — and most mornings you need both.
AI operational intelligence
Let AI detect operational patterns before they become bigger problems.
AI identifies operational patterns, surfaces signals and supports configured actions using the hospital's connected data, rules and workflows. It does not make clinical decisions.
Operational data
Occupancy · TAT · volume · workload · OT · flow
From connected systems
Intelligence engine
Detects the pattern
- Signal
- Nothing to raise
Operational signal
Discharge TAT, afternoons
To
The discharge team
To
A configured workflow
To
The management report
AI operational signal
Discharge TAT has increased 18% over the last 7 days. The increase is concentrated between 2 PM and 6 PM, across 3 departments.
Explore patternAI operational signal
OT utilisation is below the configured threshold on Fridays. The pattern holds across the last 6 weeks.
Explore patternManagement
Give leadership a clear view of what is changing.
What changed, where, and what needs attention — without inspecting every operational metric individually.
This month
- Bed occupancy82.4%2.2%
- OT utilisation76.0%0.4%
- Discharge TAT3.2 hrs18%
- Lab TAT58 min11%
- OPD footfall32,84012.4%
One change needs somebody this month: discharge TAT is above its configured target, and it is the only measure here that is.
Reporting
Send the right operational intelligence to the right team.
Not everyone needs to open the intelligence workspace every morning. Package configured operational intelligence into scheduled reports instead.
Report
Operations summary
Recipients
- Care operations
- Department heads
- Administration
- COO
- Leadership
- OPD footfall
- 1,284 12.4%
- Admissions
- 146 6.1%
- Discharges
- 132 0.8%
- Bed occupancy rate
- 82.4% 2.2%
- Average waiting time
- 24 min 4%
- Discharge TAT
- 3.2 hrs 18%
3 operational signals require attention.
3 signals- OPD footfall
- 7,910 9.2%
- Admissions
- 982 4.4%
- Bed occupancy rate
- 81.8% 1.6%
- OT utilisation
- 76% 0.4%
- Discharge TAT
- 3.1 hrs 14%
- Lab TAT
- 59 min 9%
Key operational change: discharge TAT rose through the second half of the week.
1 signal- OPD footfall
- 32,840 12.4%
- Bed occupancy rate
- 82.4% 2.2%
- ALOS
- 4.8 days 0.1
- OT utilisation
- 76% 0.4%
- Discharge TAT
- 3.2 hrs 18%
- Lab TAT
- 58 min 11%
Key operational change: discharge TAT increased 18% this month and is above its configured target.
Above targetAutomate the reporting layer so teams and management receive operational intelligence without preparing the same report every morning.
Signal to action
See the problem. Understand the pattern. Act on it.
Data
Discharge TAT rising
Intelligence
Afternoon bottleneck
Signal
Discharge team
Workflow
Configured workflow
Action
Task raised
Operational Intelligence becomes valuable when insight can move directly into the work that needs to happen next.
FAQ
Frequently asked questions
What is Operational Intelligence in a hospital?
Operational Intelligence gives hospitals visibility into how their operations are performing across capacity, patient flow, departments, workforce, turnaround times, utilisation and throughput.
What is the difference between Patient Intelligence and Operational Intelligence?
Patient Intelligence focuses on patient journeys, engagement, retention and experience. Operational Intelligence focuses on how the hospital itself is operating across departments, resources, processes and capacity.
What hospital KPIs can be tracked?
Depending on connected data sources, hospitals can track metrics such as BOR, ALOS, LOS, TAT, OT Utilisation, Admission TAT, Discharge TAT, Lab TAT, Radiology TAT, Average Waiting Time, Capacity Utilisation, Throughput, OPD Footfall and Bed Turnover Rate.
Can MeloHealth monitor Bed Occupancy Rate?
Yes, when the required bed availability and occupancy data is available through a connected hospital system or data source.
Can hospitals compare departments?
Yes. Operational data can be organised by department, allowing hospitals to compare relevant volume, TAT, utilisation and other configured operational measures.
Can Operational Intelligence identify bottlenecks?
It can surface operational signals and patterns from connected data, such as changes in TAT, utilisation or workload, subject to the available data and configured thresholds.
Can AI take operational actions?
AI can support configured operational actions through MeloHealth's workflows, routing and automation capabilities. Actions should follow the hospital's configured rules and permissions.
Can management receive automated reports?
Yes. Configured operational reports can be scheduled for different frequencies, departments and recipients, depending on the available reporting and delivery setup.