Patient Intelligence

Understand every patient beyond the record.

Turn patient journeys, interactions and engagement data into a clearer view of what is happening — from the first enquiry to follow-up and return visits.

Patient Intelligence Last 30 days
  • Patients 12,840
  • New patients 4,820
  • Returning 8,020
  • Follow-ups due 326
  • Patient retention 78.4%
  • Repeat visit rate 42.1%
  • Follow-up compliance 71.2%

Patient journey

  1. Enquiry
  2. Appointment
  3. OPD
  4. Follow-up
  5. Return
Insight

Follow-up completion dropped 4.2% this week.

View affected patients

Patient 360

One patient. One connected picture.

Everything that happened around one patient, in the order it happened — so the next conversation starts from what is already known.

Patient 360 Connected record
PS
Priya SharmaPatient ID #28491 · Cardiology
  1. Appointment booked

    Booked on WhatsApp. Cardiology, Dr A. Rao.

  2. OPD visit

    Consultation completed. Diagnostics advised.

  3. Report shared

    Lipid profile delivered and opened.

  4. Follow-up due

    Recommended review four weeks after the visit.

  5. No response

    Two reminders sent. Nothing back yet.
See the relationship around the patient, not just the patient record.

Patient journey intelligence

See where patients move forward — and where they drop off.

Every stage of the journey, how many patients reached it, and how many did not continue. Select a stage to read its numbers.

OPD

1,624 patients

Conversion to diagnostics
72.8%
Drop-off
27.2%

Patients advised diagnostics on the same day complete them more often.

Explore
  • Continued
  • ·
  • Did not continue
Stage OPD 1,624 patients
Continued Diagnostics 1,182 · 72.8%
Did not continue Drop-off 442 · 27.2%

A drop-off is a stage, not a failure.

Patients leave a journey for ordinary reasons — a report collected elsewhere, a review no longer needed, a number that changed. Naming the stage where they left is what makes the next step a decision rather than a guess.

See what happens next

Every figure on this page is an illustrative example. What a hospital can actually measure depends on the systems connected, the data available and the journey definitions configured.

Retention & returning patients

Understand whether patients come back.

Patient retention rate

78.4%

6.8% vs previous period

Jan Feb Mar Apr May Jun
  • Repeat visit rate42.1%2.4%
  • Reactivation rate18.6%1.1%
  • New patient ratio37.5%0.2%

Returning patients increased 6.8% compared with the previous period.

Engagement & experience

Understand how patients experience the hospital between visits.

Engagement is whether patients answer. Experience is what they thought of it. They are different questions, so they are two views of the same section.

  • Response rate 74% Patients who replied to at least one message
  • Feedback response 38% Replies to a feedback request after a visit
  • Follow-up response 54% Replies to a follow-up reminder

9.3% Patient response rate increased this month.

Follow-up intelligence

Know which patients need attention.

A queue, not a chart. Open a row to see why a patient is on it.

Follow-up queue 108 pending
  • Due326
  • Completed218
  • Pending108
  • PSPriya Sharma Follow-up due
    Last visit
    09 Sep
    Follow-up
    28 Sep
    Last response
    3 days ago
    Segment
    Returning
  • RKRahul Kumar Completed
    Last visit
    02 Sep
    Follow-up
    21 Sep
    Last response
    21 Sep
    Segment
    Returning
  • ARAnita Rao No response
    Last visit
    14 Sep
    Follow-up
    28 Sep
    Last response
    3 days ago
    Segment
    Follow-up pending
  • VSVikram Singh Pending
    Last visit
    18 Sep
    Follow-up
    02 Oct
    Last response
    19 Sep
    Segment
    New

Patient segments

Turn patient patterns into useful groups.

The whole patient population, split the way the hospital actually talks about it. Select a group to open it.

All patients

12,840

New patients

4,820

First visit
Within 90 days
Converted to a second visit
31.4%
Feedback response
44%
Create journey

Insights

Don’t just show the numbers. Show what changed.

Management intelligence, not notifications: what moved, by how much, and where to look next.

  1. Repeat visit rate

    42.1%

    Up 6.8% compared with the previous period.

    Explore
  2. Follow-up compliance

    71.2%

    108 follow-ups remain incomplete.

    Explore
  3. Patient drop-off

    16.3%

    Highest between appointment and OPD.

    Explore

Intelligence that learns & acts

Let AI learn from patient patterns — and take the next configured action.

Patient Intelligence does not stop at showing what happened. Configured patient data, journeys, rules and outcomes let the engine recognise a pattern and start the step the hospital has already approved for it.

  • Learn
  • →
  • Understand
  • →
  • Detect
  • →
  • Act
  • Visits
  • Conversations
  • Appointments
  • Follow-ups
  • Feedback
  • Journey outcomes
AI intelligence engine Reads configured patient data and the patterns inside it
  • Pattern found
  • No signal
  • Understands patterns
  • Identifies signals
  • Checks configured rules
Patient Configured reminder sent
Team Task routed to the care team
Workflow Follow-up journey started
  1. 01Patient visited OPD
  2. 02Follow-up recommended
  3. 03No responseTwo reminders, nothing back
  4. 04Missed follow-up detectedAgainst the configured schedule
  5. 05Configured rules checked
  6. 06Enters “Follow-up pending”A segment the hospital defined
  7. 07Configured reminder sent
  8. 08Still unresolved → routed to the care teamA person takes it from here
AI signal

Patient has not completed the recommended follow-up.

Pattern
Similar patients often respond after a reminder
Recommended action
Start configured follow-up journey
Review action

AI learns from configured data and patterns, understands the context, and takes configured operational actions — with human involvement where required.

This is patient engagement and hospital operations, not clinical decision-making. The engine does not diagnose, does not decide treatment, and does not act outside the rules a hospital has configured for it.

Intelligence → management

Turn patient intelligence into reports your teams can act on.

Not everyone opens the intelligence workspace every day. Automate the reporting layer so teams and management receive what they need without preparing the same report every morning.

Report

Patient Intelligence Summary

Frequency
Delivery

Recipients

  • Care team
  • Front desk
  • Department head
  • Hospital management
  • Leadership
Monthly management review 1st · 08:00
Patient retention
78.4%
Repeat visit rate
42.1%
Reactivation
18.6%
Follow-up compliance
71.2%

Top change: follow-up drop-off increased between OPD and follow-up.

To: Hospital management

Data → intelligence → report → the right team, at the right time.

Intelligence → action

When you know what is happening, take the next step.

Insight Follow-up compliance down 4.2% Needs attention
Patients 108 follow-ups still open
Patient segment Follow-up pending Rebuilt as the data changes
Workflow Reminder journey Configured
Team Assignment to the care team Configured

Move from understanding patients to acting on what needs attention.

See how workflows are built

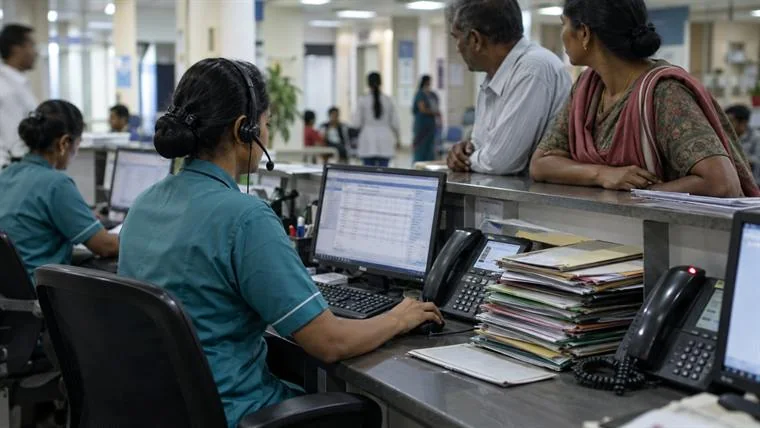
Hospital front-desk staff working at their terminals while patients are attended at the counter

Give your teams the context to understand patients better.

Patient Intelligence is read by the people who call, confirm, follow up and resolve. It tells them which patients need attention across the journey, and why — so the next conversation does not start from nothing.

FAQ

Questions hospitals ask.

What is Patient Intelligence?

Patient Intelligence helps hospitals understand patient journeys, engagement, retention, follow-ups and experience using data from connected systems and patient interactions.

How is Patient Intelligence different from Patient 360?

Patient 360 brings relevant patient information together. Patient Intelligence uses that information to identify trends, patterns, journey performance and areas that may need attention.

What patient data can be used?

Depending on connected systems and permissions, MeloHealth can work with information such as appointments, visits, conversations, requests, follow-ups, engagement and configured patient attributes.

Can hospitals track Patient Retention Rate and Repeat Visit Rate?

Yes, when the required patient and visit data is available and the hospital’s cohort and measurement definitions are configured.

Can MeloHealth identify patient drop-offs?

Patient journey data can be used to identify where patients leave a defined journey before the intended next step, subject to available data and the journey definition.

Can Patient Intelligence track follow-up compliance?

Yes. Where scheduled or recommended follow-up information is available, hospitals can measure follow-up completion and related metrics.

Can Patient Intelligence work with HIMS or HIS data?

Yes, where the hospital system provides a supported integration method such as an API, webhook or another compatible interface.

Can insights trigger actions?

Patient Intelligence can connect with configured segments, workflows, teams and other MeloHealth capabilities so identified situations can lead to an appropriate next step.

Know what is happening across every patient journey.

Turn connected patient data into clearer visibility across engagement, retention, experience and follow-up.

Patient 360 — the record this intelligence reads from